Summary: This project aims to segment customers based on their behavior in the market using the k-means clustering algorithm. By grouping customers into clusters, this analysis will support more targeted decision-making for each distinct group, enhancing business strategies.
Data Source:
The dataset for this project is sourced from the UCI Machine Learning Repository: https://archive.ics.uci.edu/dataset/352/online+retail.
It includes transactional data between 01/12/2010 and 09/12/2011 for a UK-based online retailer. Due to the dataset’s large size, only a subset has been analyzed. Clustering is performed using two numerical attributes: Quantity and UnitPrice.
Technical Note: What is K-Means? K-means is an iterative, centroid-based clustering algorithm that partitions a dataset into distinct groups based on similarity. The algorithm assigns each data point to a cluster whose center (centroid) is the mean or median of all points in that cluster.
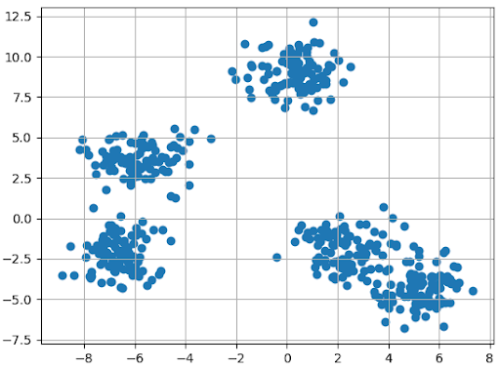
A sample output of k-means:
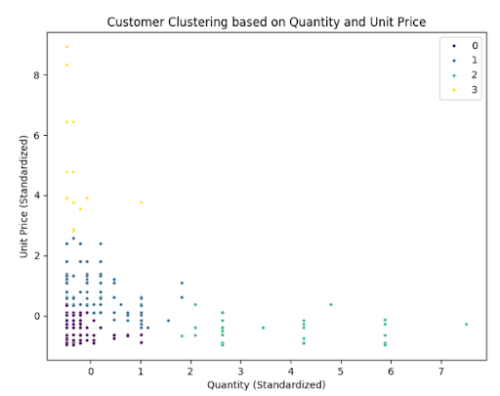
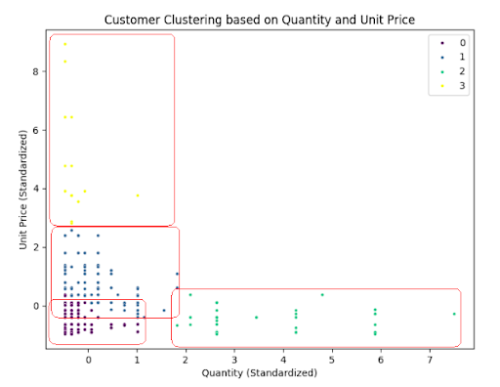
Result Description: The k-means model categorized the purchases into four groups:
Group 0 (Purple): Purchases of inexpensive products in small quantities. Group 1 (Blue): This group represents the majority of purchases. Group 2 (Yellow): Purchases of expensive products in small quantities. Group 3 (Green): Purchases of inexpensive products in large quantities.
The figure of result:


Conclusion: Most customers tend to purchase inexpensive products in small quantities. When customers buy in larger quantities, the products are generally cheaper. On the other hand, if the product is expensive, it is typically purchased in smaller amounts.
Future Considerations: Nationality Analysis: We could analyze customer nationality to gain deeper insights and identify potential patterns that vary across different regions.
Customer-Based Analysis: Since some purchases belong to the same customer, analyzing individual purchasing behavior could offer valuable customer-level insights.
https://github.com/SevenSkyConsulting/cluster-market
In a bustling online retail space, customers shop in all sorts of patterns. Some buy a few high-end items, while others stock up on budget-friendly products. But what if we could understand these patterns more deeply and use them to make smarter business decisions? This project set out to do just that, by grouping customers into clusters based on their buying behavior. Using k-means clustering, we aimed to uncover distinct customer types, helping the business tailor strategies for each unique group.
Data Behind the Patterns Our data came from the UCI Machine Learning Repository, focusing on transactions from a UK-based online retailer between 2010 and 2011. With thousands of entries, we analyzed a manageable subset, focusing on two key features: Quantity (the number of items purchased) and Unit Price (the price per item). These two dimensions revealed a lot about what customers buy and how they buy it.
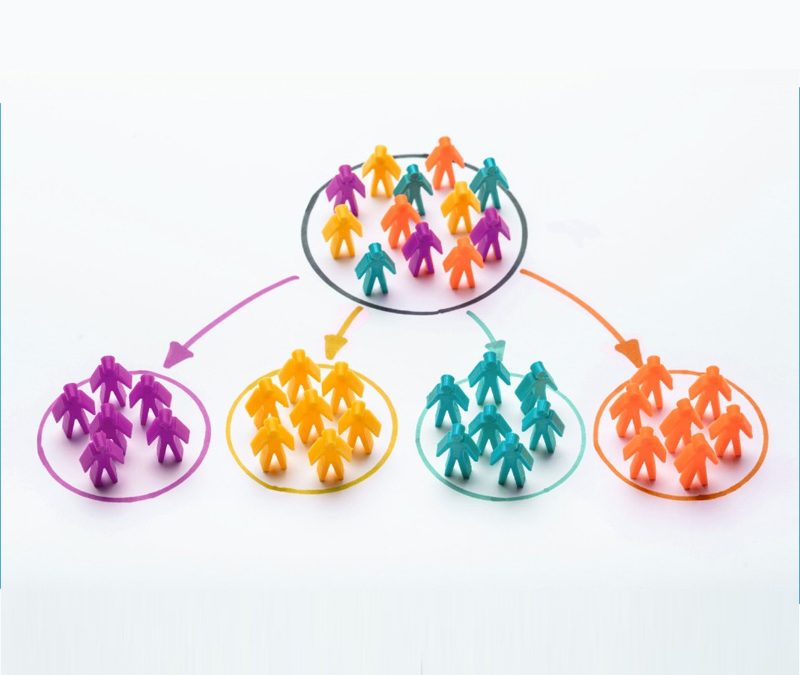
The Method: What is K-Means Clustering? We used k-means clustering, an algorithm that groups data points based on similarity. Imagine scattering customer purchases on a chart; k-means finds “centers” around which similar purchases gather. Each center represents a different customer group, or cluster. By assigning each data point to the nearest cluster center, we can identify distinct customer types.
The Results: Four Customer Groups After running the k-means algorithm, we found that customers fell into four main groups:
Group 0 (Purple): These customers buy inexpensive products in small quantities. They likely browse for budget-friendly items and pick up just a few items each time. Group 1 (Blue): Representing the majority of purchases, this group is the backbone of the retailer’s customer base. They buy in moderate amounts and tend to prefer lower-priced items. Group 2 (Yellow): These customers buy expensive products in small quantities. They’re quality-oriented, valuing high-end products but in limited amounts. Group 3 (Green): This group buys inexpensive products in large quantities. They might be resellers or bulk buyers, stocking up on affordable items in significant amounts.
(HERE IS THE PLACE THAT ABOVE CLUSTERED DATA SHOULD BE PRESENTED)
Key Insights The clusters reveal interesting patterns in customer behavior:
Inexpensive and Small Quantities Dominate: Most customers stick to buying inexpensive items in small amounts, making Group 0 the most common buying pattern. Bulk Buys at Low Prices: When customers do buy in bulk, they tend to choose cheaper items, which aligns with Group 3. Expensive Products in Small Quantities: When the price per item goes up, customers are more likely to limit their purchase to just a few items, as seen in Group 2. These insights help us understand the types of customers better, allowing the business to make targeted decisions—like promotional offers tailored to each group.
Future Directions: Deepening the Analysis This project has laid a solid foundation, but there are exciting paths to explore further:
Nationality Analysis: Adding information on customer nationality could uncover purchasing patterns across different regions, allowing for a more globally tailored marketing strategy. Customer-Based Insights: Since some entries in the data belong to the same customer, analyzing individual purchasing habits could provide a more refined view. Understanding how often a customer returns, what they buy repeatedly, and how their spending patterns shift over time would add another layer of insight.
Conclusion By segmenting customers based on purchasing behavior, this analysis provides a valuable roadmap for businesses. The clustering results guide tailored marketing, helping focus on each group’s needs and tendencies. With more data and deeper analysis, this project can evolve, making customer segmentation an even more powerful tool in understanding and serving the market.


